If you are a person who is, or has been in the past, in charge of inspecting and analyzing system logs in Linux, you know what a nightmare that task can become if multiple services are being monitored simultaneously.
In days past, that task had to be done mostly manually, with each log type being handled separately. Fortunately, the combination of Elasticsearch, Logstash, and Kibana on the server side, along with Filebeat on the client side, makes that once difficult task look like a walk in the park today.
The first three components form what is called an ELK stack, whose main purpose is to collect logs from multiple servers at the same time (also known as centralized logging).
A built-in java-based web interface allows you to inspect logs quickly at a glance for easier comparison and troubleshooting. These client logs are sent to a central server by Filebeat, which can be described as a log shipping agent.
Testing Environment
Let’s see how all of these pieces fit together. Our test environment will consist of the following machines:
Central Server: RHEL with IP address 192.168.100.247
Client Machine #1: Fedora with IP address 192.168.100.133
Client Machine #2: Debian with IP address 192.168.0.134
Please note that the RAM requirements for the ELK Stack (Elasticsearch, Logstash, and Kibana) can vary based on factors such as data volume, complexity of queries, and the size of your environment.
How to Install ELK Stack on RHEL
Let’s begin by installing the ELK stack on the central server (which is our RHEL 9 system), the same instructions apply to RHEL-based distributions such as Rocky and Alma Linux.
Let’s understand with a brief explanation on what each component does:
- Elasticsearch stores the logs that are sent by the clients.
- Logstash processes those logs.
- Kibana provides the web interface that will help us to inspect and analyze the logs.
Install the following packages on the central server. First off, we will install Java JDK version 21, the latest one at the time of this writing), which is a dependency of the ELK components.
You may want to check first in the Java downloads page here to see if there is a newer update available.
yum update
cd /opt
wget https://download.oracle.com/java/21/latest/jdk-21_linux-x64_bin.rpm
rpm -Uvh jdk-21_linux-x64_bin.rpm
Time to check whether the installation completed successfully:
java -version java version "21.0.2" 2024-01-16 LTS
Java(TM) SE Runtime Environment (build 21.0.2+13-LTS-58)
Java HotSpot(TM) 64-Bit Server VM (build 21.0.2+13-LTS-58, mixed mode, sharing)
To install the latest versions of Elasticsearch, Logstash, and Kibana, we will have to create repositories manually as follows:
Install Elasticsearch in RHEL
1. Import the Elasticsearch public GPG key to the rpm package manager.
rpm --import https://artifacts.elastic.co/GPG-KEY-elasticsearch
2. Insert the following lines to the repository configuration file elasticsearch.repo:
[elasticsearch]
name=Elasticsearch repository for 8.x packages
baseurl=https://artifacts.elastic.co/packages/8.x/yum
gpgcheck=1
gpgkey=https://artifacts.elastic.co/GPG-KEY-elasticsearch
enabled=0
autorefresh=1
type=rpm-md
3. Install the Elasticsearch package.
yum install --enablerepo=elasticsearch elasticsearch
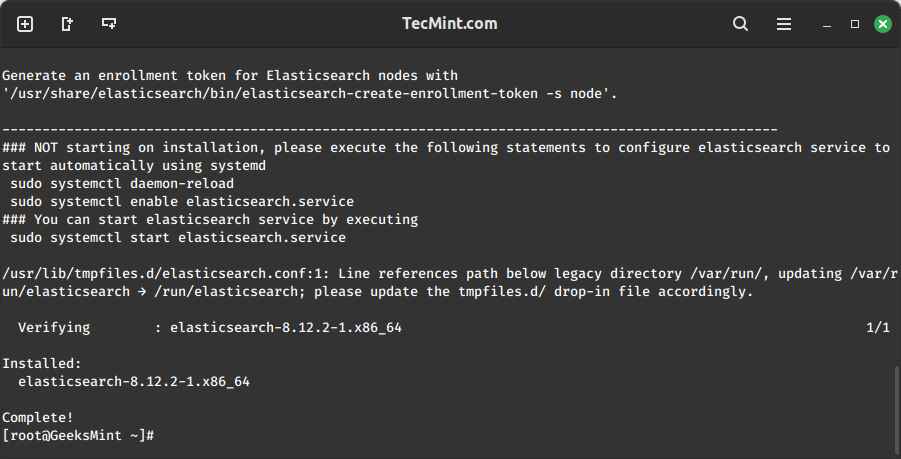
When the installation is complete, you will be prompted to start and enable elasticsearch:
4. Start and enable the service.
-
BEST Webhosting
Explore a comprehensive array of web hosting services designed to cater to various needs. Whether you’re an individual looking for reliable personal hosting or a business requiring high-performance solutions, BEST Webhosting offers tailored options to ensure optimal website performance, robust security, and 24/7 support.
-
Unveiling the Pillars of Web Hosting
Web hosting is the backbone of a digital presence, providing the infrastructure necessary to publish and maintain websites online. This article delves deep into the essentials of web hosting, guiding individuals and businesses to make informed decisions. Learn about hosting types, server performance, and scalability options to choose the perfect fit for your online goals.
-
Digital Experience and Coding a New Website
Building a website today involves more than creating an online presence; it’s about delivering an exceptional digital experience. This piece explores modern website design principles, user experience strategies, and advanced coding techniques. It highlights how a well-crafted website can effectively convey your brand message, captivate audiences, and drive business success.
-
How to Buy a .com.au Domain: A Buyer’s Guide to .com.au Domains
This guide is a must-read for startups and established businesses aiming to enhance their Australian online presence. Learn the steps to secure a .com.au domain that aligns perfectly with your brand identity. The article provides insights into domain registration requirements, tips for choosing a memorable domain name, and the benefits of a local domain for SEO.
-
Edge of Technology, Digital Transformation, and Cloud Computing
Staying competitive in today’s fast-paced digital landscape requires leveraging cutting-edge technologies. This article explores the vital roles of Digital Transformation (DT) and Cloud Computing in modern business strategies. Understand how these technologies drive efficiency, foster innovation, and enable organisations to scale operations seamlessly.
-
The Best WordPress Plugins for Email Marketing to Grow and Engage Your Subscriber List
Email marketing remains a powerful tool for audience engagement and lead conversion. Discover top WordPress plugins like Mailchimp, Constant Contact, OptinMonster, and Thrive Leads. This article provides detailed guidance on creating effective opt-in forms, segmenting email lists, automating campaigns, and tracking metrics for successful email marketing strategies.
-
The Best WordPress Caching Plugins to Optimize Site Speed and Performance
Website speed and performance are crucial for user experience and SEO rankings. This detailed review covers the most effective WordPress caching plugins, including W3 Total Cache, WP Super Cache, WP Rocket, WP Fastest Cache, and LiteSpeed Cache. Learn how these plugins enhance site performance by minimising load times and optimising server resources.
systemctl daemon-reload
systemctl enable elasticsearch
systemctl start elasticsearch
5. Allow traffic through TCP port 9200 in your firewall:
firewall-cmd --add-port=9200/tcp
firewall-cmd --add-port=9200/tcp --permanent
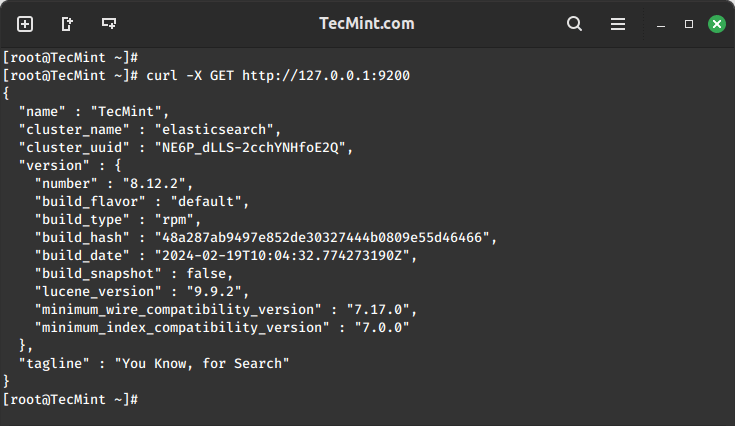
6. Check if Elasticsearch responds to simple requests over HTTP using curl command:
curl -X GET http://localhost:9200
The output of the above command should be similar to:
Make sure you complete the above steps and then proceed with Logstash. Since both Logstash and Kibana share the Elasticsearch GPG key, there is no need to re-import it before installing the packages.
Install Logstash in RHEL
7. Insert the following lines to the repository configuration file /etc/yum.repos.d/logstash.repo:
[logstash-8.x]
name=Elastic repository for 8.x packages
baseurl=https://artifacts.elastic.co/packages/8.x/yum
gpgcheck=1
gpgkey=https://artifacts.elastic.co/GPG-KEY-elasticsearch
enabled=1
autorefresh=1
type=rpm-md
8. Install the Logstash package:
yum install logstash
9. Add a SSL certificate based on the IP address of the ELK server at the following line below the [ v3_ca ] section in /etc/pki/tls/openssl.cnf:
[ v3_ca ]
subjectAltName = IP: 192.168.100.247
10. Generate a self-signed certificate valid for 365 days:
# cd /etc/pki/tls
# openssl req -config /etc/pki/tls/openssl.cnf -x509 -days 3650 -batch -nodes -newkey rsa:2048 -keyout private/logstash-forwarder.key -out certs/logstash-forwarder.crt
11. Configure Logstash input, output, and filter files:
Input: Create /etc/logstash/conf.d/input.conf and insert the following lines into it. This is necessary for Logstash to “learn” how to process beats coming from clients. Make sure the path to the certificate and key match the right paths as outlined in the previous step:
input { beats { port => 5044 ssl => true ssl_certificate => "/etc/pki/tls/certs/logstash-forwarder.crt" ssl_key => "/etc/pki/tls/private/logstash-forwarder.key" }
}
Output (/etc/logstash/conf.d/output.conf) file:
output { elasticsearch { hosts => ["localhost:9200"] sniffing => true manage_template => false index => "%{[@metadata][beat]}-%{+YYYY.MM.dd}" document_type => "%{[@metadata][type]}" }
}
Filter (/etc/logstash/conf.d/filter.conf) file. We will log syslog messages for simplicity:
filter {
if [type] == "syslog" { grok { match => { "message" => "%{SYSLOGLINE}" } } date {
match => [ "timestamp", "MMM d HH:mm:ss", "MMM dd HH:mm:ss" ]
} }
}
12. Start and enable logstash:
systemctl daemon-reload
systemctl start logstash
systemctl enable logstash
13. Configure the firewall to allow Logstash to get the logs from the clients (TCP port 5044):
firewall-cmd --add-port=5044/tcp
firewall-cmd --add-port=5044/tcp --permanent
Install Kibana in RHEL
13. Insert the following lines to the repository configuration file /etc/yum.repos.d/kibana.repo:
[kibana-8.x]
name=Kibana repository for 8.x packages
baseurl=https://artifacts.elastic.co/packages/8.x/yum
gpgcheck=1
gpgkey=https://artifacts.elastic.co/GPG-KEY-elasticsearch
enabled=1
autorefresh=1
type=rpm-md
14. Install the Kibana package:
yum install kibana
15. Start and enable Kibana.
systemctl daemon-reload
systemctl start kibana
systemctl enable kibana
16. Make sure you can access access Kibana’s web interface from another computer (allow traffic on TCP port 5601):
firewall-cmd --add-port=5601/tcp
firewall-cmd --add-port=5601/tcp --permanent
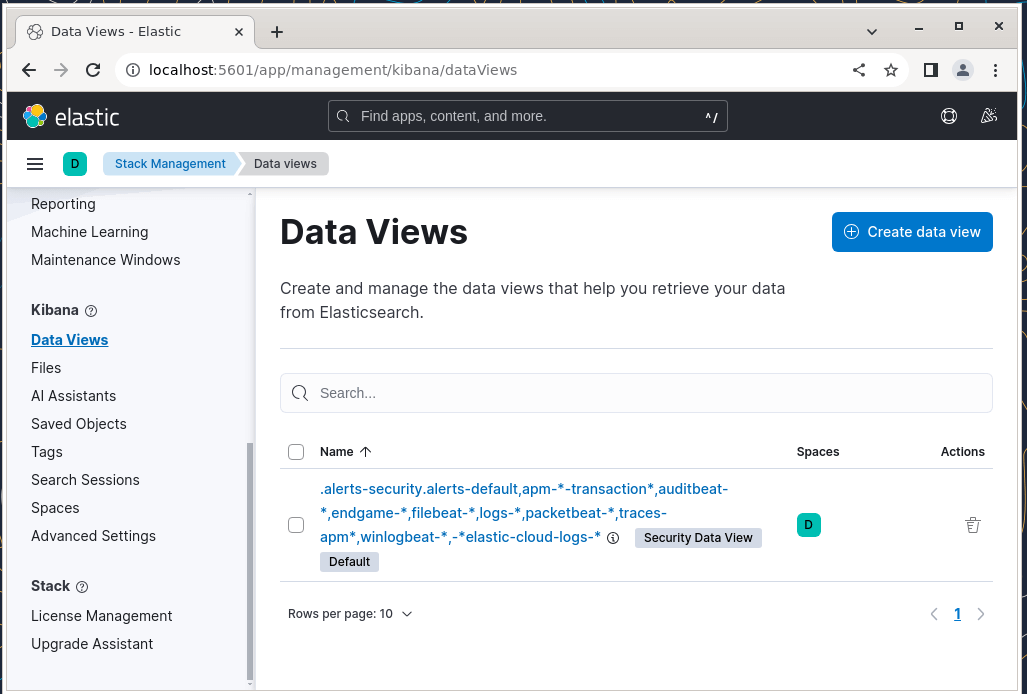
17. Launch Kibana to verify that you can access the web interface:
http://localhost:5601
OR
http://IP.com:5601
Install Filebeat on the Client Machine
We will show you how to do this for Client #1 (repeat for Client #2 afterward, changing paths if applicable to your distribution).
1. Copy the SSL certificate from the server to the clients using the scp command:
scp /etc/pki/tls/certs/logstash-forwarder.crt [email protected]:/etc/pki/tls/certs/
2. Import the Elasticsearch public GPG key to the rpm package manager on the client machine:
rpm --import https://artifacts.elastic.co/GPG-KEY-elasticsearch
3. Create a repository for Filebeat (/etc/yum.repos.d/filebeat.repo) in RHEL-based distributions:
[elastic-8.x]
name=Elastic repository for 8.x packages
baseurl=https://artifacts.elastic.co/packages/8.x/yum
gpgcheck=1
gpgkey=https://artifacts.elastic.co/GPG-KEY-elasticsearch
enabled=1
autorefresh=1
type=rpm-md
4. Configure the source to install Filebeat on Debian-based distributions:
wget -qO - https://artifacts.elastic.co/GPG-KEY-elasticsearch | sudo apt-key add -
sudo apt-get install apt-transport-https
echo "deb https://artifacts.elastic.co/packages/8.x/apt stable main" | sudo tee -a /etc/apt/sources.list.d/elastic-8.x.list
5. Install the Filebeat package:
yum install filebeat [On RHEL and based Distros]
apt install filebeat [On Debian and its derivatives]
6. Start and enable Filebeat:
systemctl start filebeat
systemctl enable filebeat
Configure Filebeat
A word of caution here. Filebeat configuration is stored in a YAML file, which requires strict indentation. Be careful with this as you edit /etc/filebeat/filebeat.yml as follows:
- Under paths, indicate which log files should be “shipped” to the ELK server.
- Under prospectors:
input_type: log
document_type: syslog
- Under output:
- Uncomment the line that begins with logstash.
- Indicate the IP address of your ELK server and port where Logstash is listening in hosts.
- Make sure the path to the certificate points to the actual file you created in Step I (Logstash section) above.
The above steps are illustrated in the following image:

Save changes, and then restart Filebeat on the clients:
systemctl restart filebeat
Once we have completed the above steps on the clients, feel free to proceed.
Testing Filebeat
In order to verify that the logs from the clients can be sent and received successfully, run the following command on the ELK server:
curl -XGET 'http://localhost:9200/filebeat-*/_search?pretty'
The output should be similar to (notice how messages from /var/log/messages and /var/log/secure are being received from client1 and client2):
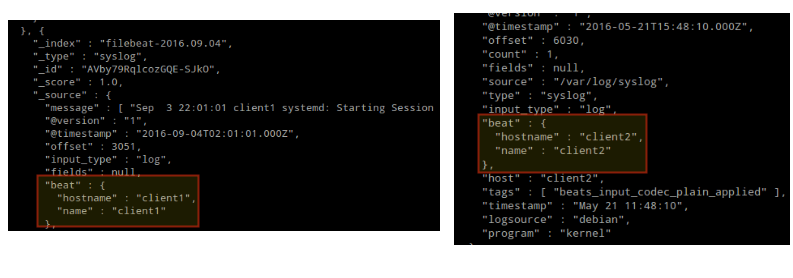
Otherwise, check the Filebeat configuration file for errors.
# journalctl -xe
after attempting to restart Filebeat will point you to the offending line(s).
Testing Kibana
After we have verified that logs are being shipped by the clients and received successfully on the server. The first thing that we will have to do in Kibana is configure an index pattern and set it as default.
You can describe an index as a full database in a relational database context. We will go with filebeat-* (or you can use more precise search criteria as explained in the official documentation).
Enter filebeat-* in the Index name or pattern field and then click Create:
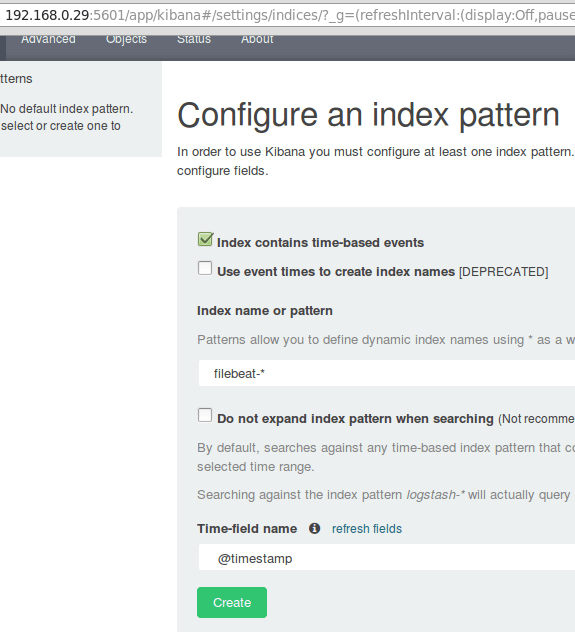
Please note that you will be allowed to enter a more fine-grained search criteria later. Next, click the star inside the green rectangle to configure it as the default index pattern:

Finally, in the Discover menu, you will find several fields to add to the log visualization report. Just hover over them and click Add:
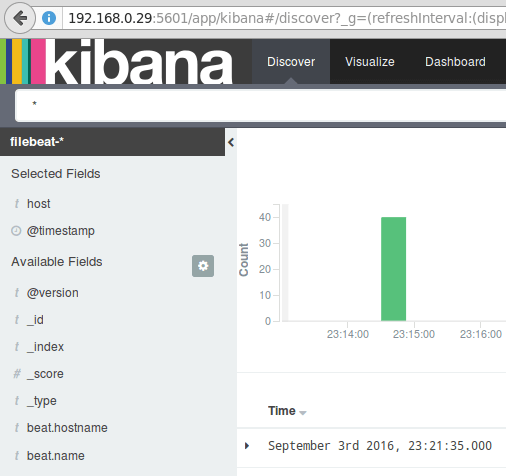
The results will be shown in the central area of the screen as shown above. Feel free to play around (add and remove fields from the log report) to become familiar with Kibana.
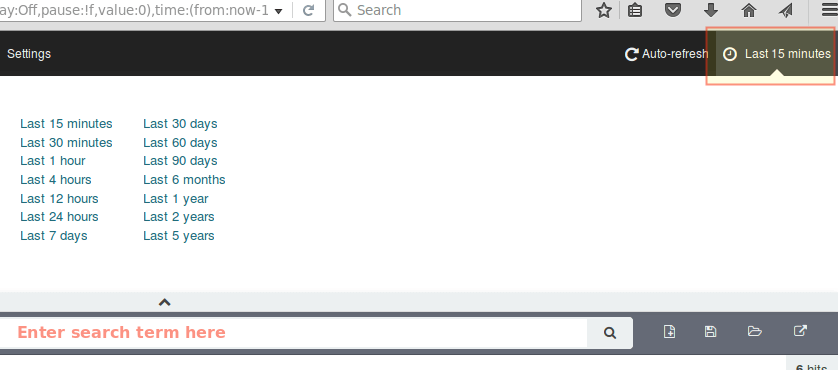
By default, Kibana will display the records that were processed during the last 15 minutes (see upper right corner) but you can change that behavior by selecting another time frame:
Summary
In this article, we have explained how to set up an ELK stack to collect the system logs sent by two clients, a Fedora, and a Debian machine.
Now you can refer to the official Elasticsearch documentation and find more details on how to use this setup to inspect and analyze your logs more efficiently.
If you have any questions, don’t hesitate to ask. We look forward to hearing from you.

