Earlier, we’ve written about many Linux System Monitor Tools that can be used to monitor the performance of Linux systems, but we think that most users prefer the default one that comes with every Linux distribution i.e. top command (real-time monitoring of system processes).
The top command is the real-time task manager in Linux and the most frequently used system monitoring tool in GNU/Linux distributions to find the performance-related bottlenecks in the system which help us to take corrective actions.
It has a nice minimalist interface and comes with a few amount of reasonable options that enable us to get real-time monitoring of system processes such as CPU usage, memory usage, and other critical system information.
However, sometimes it is very tricky to find an application/process that consumes lots of system resources is a bit difficult under the top. Because the top command doesn’t have the ability to highlight programs that are eating too much CPU, RAM, and other resources.
For keeping such an approach, here we are bringing a powerful system monitor program called “Glances” that automatically highlights programs that are utilizing the highest system resources and providing maximum information about Linux/Unix servers.
What is Glances?
Glances is a cross-platform command-line curses-based system monitoring tool written in Python language which uses the psutil library to grab information from the system.
With Glances, we can monitor CPU, Load Average, Memory, Network Interfaces, Disk I/O, Processes, and File System space utilization.
Glances is a free tool and licensed under GPL to monitor GNU/Linux and FreeBSD operating systems. There are lots of interesting options available in Glances as well.
One of the main features we have seen in Glances is that we can set thresholds (careful, warning, and critical) in the configuration file and information will be shown in colors which indicates the bottleneck in the system.
Glances Features
- CPU Information (user-related applications, system core programs, and idle programs.
- Total memory Information including RAM, Swap, Free memory, etc.
- The average CPU load for the past 1min, 5mins, and 15 mins.
- Network Download/Upload rates of network connections.
- A total number of processes, active ones, sleeping processes, etc.
- Disk I/O related (read or write) speed details
- Currently mounted devices disk usages.
- Top processes with their CPU/Memory usages, Names, and location of the application.
- Shows the current date and time at the bottom.
- Highlights processes in Red that consumes the highest system resources.
Here is an example screen grab of Glances.
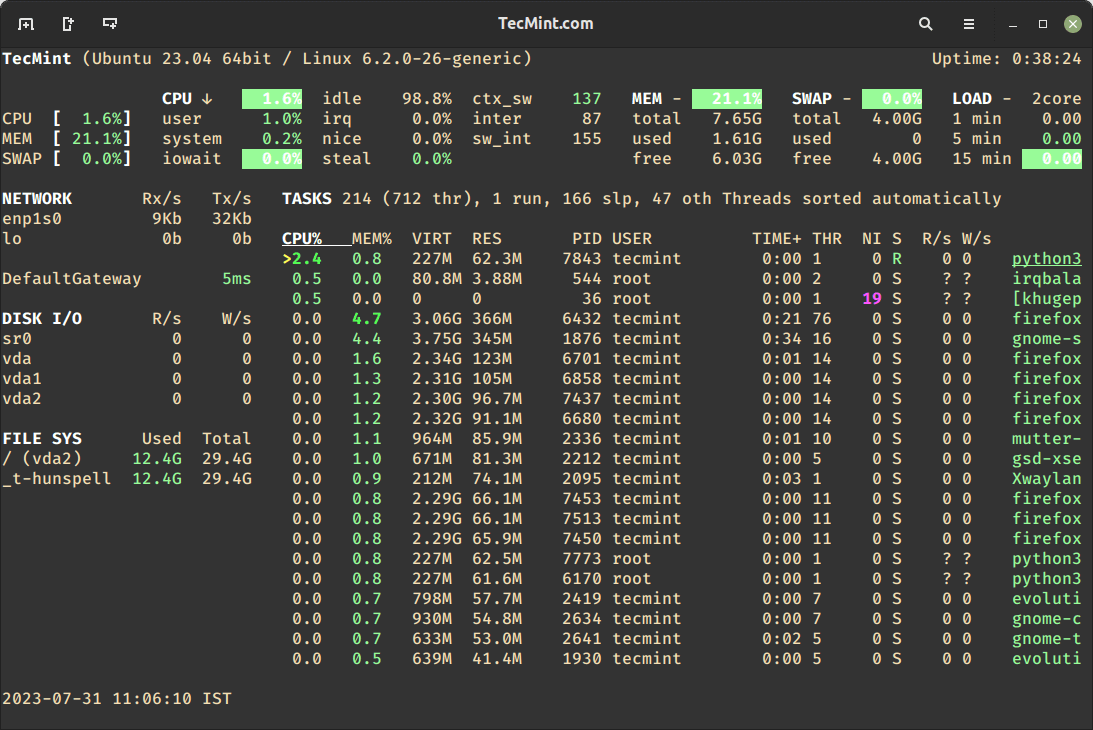
Install Glances in Linux Systems
Although it’s a very young utility, you can install “Glances” in RedHat-based systems by turning on the EPEL repository and then running the following yum commands on the terminal.
Install Glances in RHEL Systems
# yum install -y epel-release
# yum install -y glances
Install Glances in Debian Systems
You can use the apt command to install Glances on Debian-based distributions as shown.
$ apt install glances
On other Linux distributions, you can install glances using the default package manager as shown.
$ sudo emerge -a sys-apps/glances [On Gentoo Linux]
$ sudo apk add glances [On Alpine Linux]
$ sudo pacman -S glances [On Arch Linux]
$ sudo zypper install glances [On OpenSUSE]
Monitor Linux Performance with Glances
To start monitoring the performance of your running Linux system, issue the following command on the terminal.
# glances

To stop Glances, you can press ‘q‘ or (‘ESC‘ or ‘Ctrl&C‘) in the terminal where Glances is running.
Run Glances in Web Server Mode
To run Glances in Web server mode, you need to add -w option to remotely monitor the system’s performance and resource usage through a user-friendly web interface.
# glances -w
Once Glances is running in Web server mode, it will provide you with the following URL to access the web interface.
http://localhost:61208
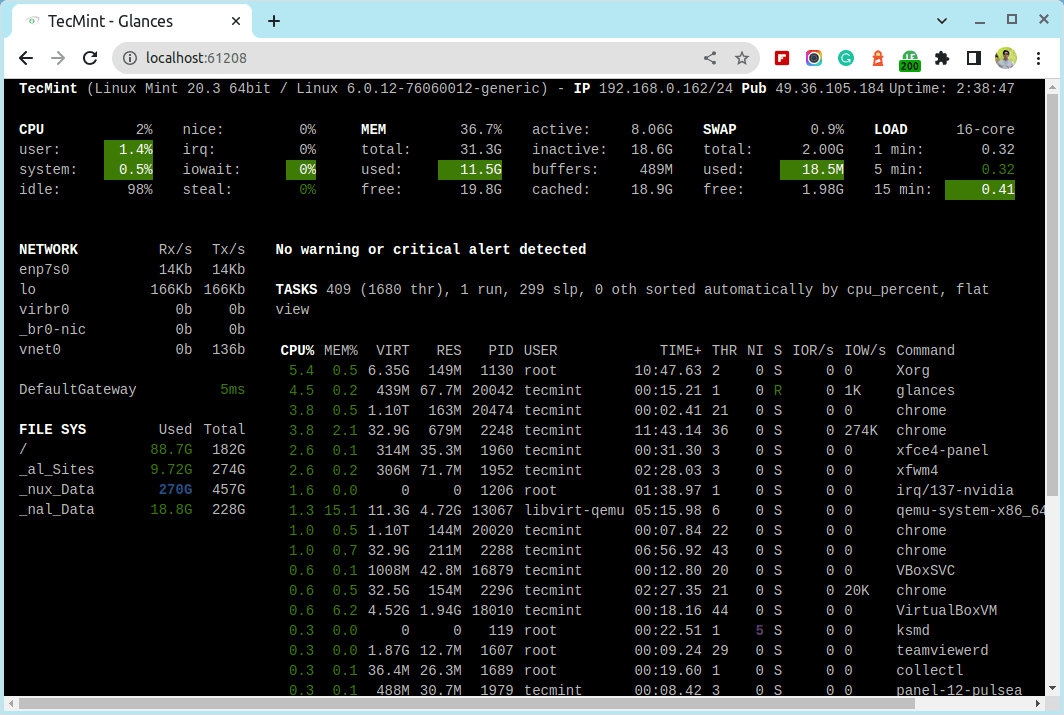
Besides, several command line options, glances provide many more hot keys to find output information while glances is running.
Glances Usage and Options
Below are the list of several hotkeys.
a– Sort processes automaticallyc– Sort processes by CPU%m– Sort processes by MEM%p– Sort processes by namei– Sort processes by I/O rated– Show/hide disk I/O statsf– Show/hide file system statshddtempn– Show/hide network statss– Show/hide sensors statsy– Show/hide hddtemp statsl– Show/hide logsb– Bytes or bits for network I/Ooolsw– Delete warning logsx– Delete warning and critical logsx– Delete warning and critical logs1– Global CPU or per-CPU statsh– Show/hide this help screent– View network I/O as a combinationu– View cumulative network I/Oq– Quit (Esc and Ctrl-C also work)
Monitor Remote Linux Performance with Glances
With the Glances, you can even monitor remote systems too. To use ‘glances‘ on remote systems, run the ‘glances -s‘, which enables server/client mode on the server.
# glances -s Glances XML-RPC server is running on 0.0.0.0:61209
Now, go to the remote host and execute the following command to connect to a Glances server by specifying IP address or hostname and port number as shown below. Here ‘192.168.0.162‘ is my glances server IP Address.
# glances -c 192.168.0.162:61209
Below are a few notable points that users must know while using glances in server/client mode.
- In server mode, you can set the bind address
-BADDRESS and listening TCP port-pPORT. - In client mode, you can set the TCP port of the server
-p PORT. - The default binding address is 0.0.0.0, but it listens on all network interfaces at port 61209.
- In server/client mode, limits are set by the server side.
- You can also define a password to access the server
-Ppassword.
Conclusion
Glances is a much resources friendly tool for most users. But if you’re a system administrator who’d like to quickly get an overall “idea” about systems by just glancing at the command line, then this tool will be a must-have tool for system administrators.

