Similarly to the previous tip about find out top processes by RAM and CPU usage, you can also use top command to view the same information. Perhaps there’s an extra advantage of this approach when compared to the previous one: the “header” of top provides extra information about the current status and usage of the system: the uptime, load average, and total number of processes, to name a few examples.
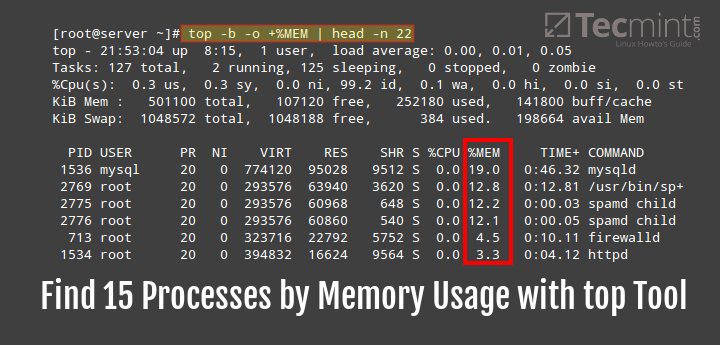
To display the top 15 processes sorted by memory use in descending order, do:
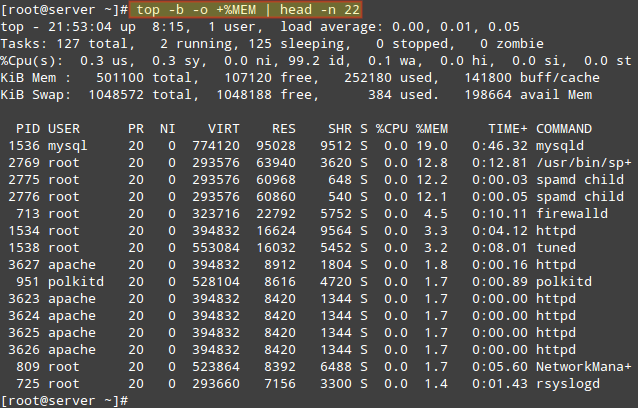
# top -b -o +%MEM | head -n 22
As opposed to the previous tip, here you have to use +%MEM (note the plus sign) to sort the output in descending order:
From the command above, the option:
-b: runs top in batch mode-o: used to specify fields for sorting processesheadutility displays the first few lines of a file and- the
-noption is used to specify the number of lines to be displayed.
Note that head utility, by default displays the first ten lines of a file, that is when you do not specify the number of lines to be displayed. Therefore, in the example above, we displayed the first 22 lines of top command output in batch mode.
Redirect or Save ‘top’ Output to File in Linux
Additionally, using top in batch mode allows you to redirect the output to a file for later inspection:
# top -b -o +%MEM | head -n 22 > topreport.txt
As we have seen, the top utility offers us more dynamic information while listing processes on a Linux system, therefore, this approach has an extra advantage compared to using ps utility which we covered in tip one.
But most importantly, you must always run top in batch mode to redirect its output to a file or another process. Additionally, if you have any tips regarding use of top, you can also share them with us via the feedback form below.